CTD² Dashboard: Content and Feature Updates
, by Kenneth Smith, Ph.D., Vlado Dancik, Ph.D., Zhou Ji, Ph.D., Aristidis Floratos, Ph.D., and Paul Clemons, Ph.D.
The Cancer Target Discovery and Development (CTD^2) Network is a collaborative functional genomics research program aiming to bridge the knowledge gap between genomic data and understanding of cancer.
In a previous e-Newsletter (2016), we described the design and implementation of the Cancer Target Discovery and Development (CTD2) Dashboard,1 which aims to make cancer-relevant results from the CTD2 Network easily discoverable by other researchers and the public. Dashboard users can directly browse or search Dashboard “subjects,” including genes, chemical compounds, cell lines, and diseases. Unique combinations of subjects positively connected by distinct types of evidence make up a Dashboard “observation.” For example, an observation may link a drug with a differentially expressed gene tested in the context of a particular cell line.
‘Search’ or ‘browse’ results are displayed in the form of “observation summaries,” which encapsulate a finding and provide links to supporting evidence. Results of interest about a subject can thus be immediately located and cross-referenced across projects and Centers. Strength of evidence is reported using the Three Evidence Tiers representing preliminary data, in vitro confirmation, and in vivo validation in relevant cancer models. All observations resulting from a particular experimental procedure in a publication, typically reporting its key results, are deposited into the Dashboard as a “submission.” A publication can give rise to multiple submissions, one for each set of findings.
Here we describe recent improvements in the capabilities of the Dashboard, focusing on a) presentation, b) annotation of experimental methods, c) the search function, and d) new links to external data resources and web applications.
Dashboard Landing Page
The Dashboard landing page (Figure 1) has been revamped to render all salient features easily accessible via buttons. The new landing page hosts a new “experimental evidence” button, which allows users to locate observations based on underlying experimental methods, and a new “Content Summary” table.
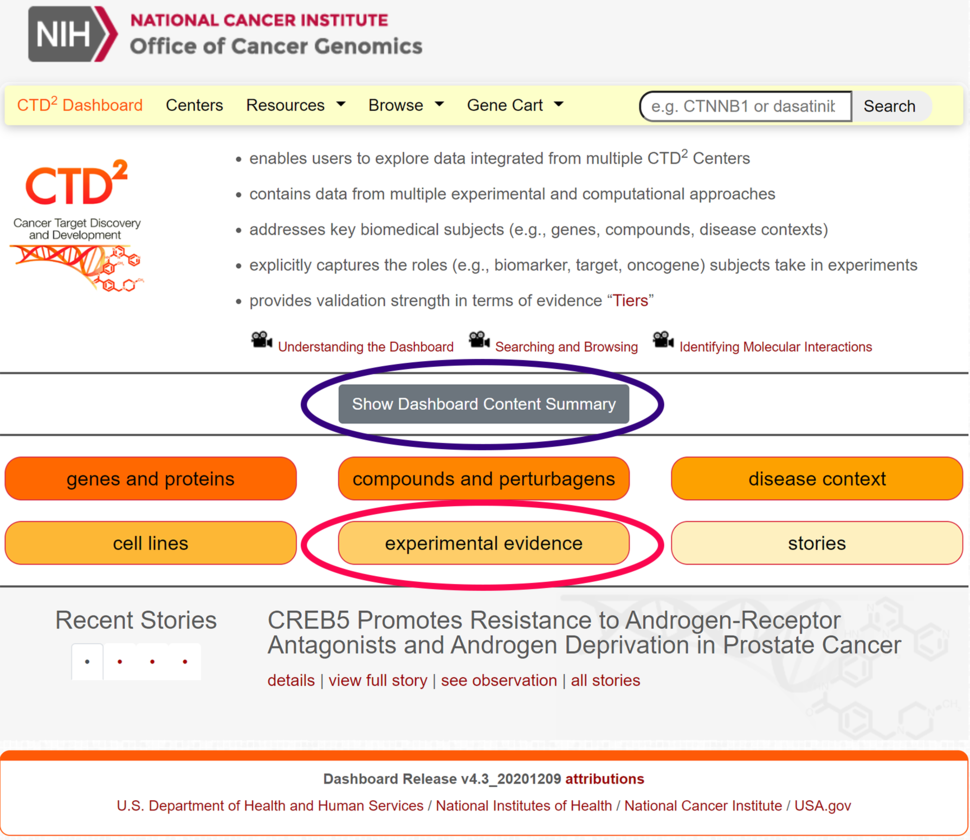
Figure 1. Updated Dashboard landing page, including content summary (purple oval) and new subject button for experimental evidence (red oval).
Dashboard Content Summary
A new Content Summary (Figure 2) supplies a quick overview of the numbers of both submissions and observations for each subject type, plus ‘evidence types’ and ‘stories’, organized by Tier. Most observations are Tier 1, with decreasing numbers for Tiers 2 and 3. As of December 31, 2020, there are 202 submissions and over 56,000 individual observations (experimental approaches such as compound screening can produce substantial number of observations). As more submissions and stories are added, these numbers will increase.
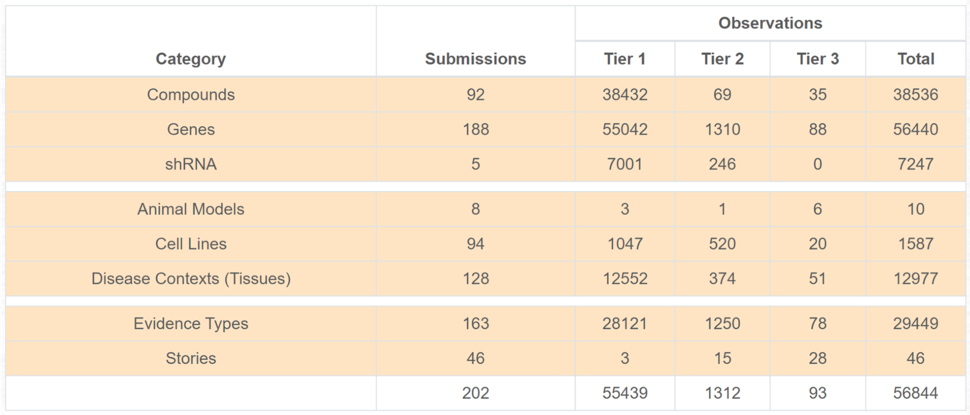
Figure 2. Dashboard content summary, accessible by a prominent button on the landing page.
To aid CTD2 Network members in creating new submissions, we implemented a sophisticated “Submission Builder” web application, which guides the submitter through each step of the process and allows the result to be previewed directly as it will appear in the Dashboard.
Structured Experimental Evidence
The “Experimental Evidence” page of the Dashboard provides a new table (Figure 3) listing Evidence and Conclusion Ontology (ECO) terms and the number of submissions and observations (by Tier) to which they have been assigned. Clicking the observation ‘count’ for a particular experimental method reveals a page displaying those observations. We chose ECO because it is an industry standard and one of the primary ontologies of evidence terms supported by the Monarch Initiative and registered in the OBO Foundry, both open-source initiatives in biomedical ontologies. ECO provides a hierarchy of terms that describe types of experimental evidence, having evidence types suitable to annotate Dashboard data, such as RNA-seq, ECO:0000295; pharmacological assay, ECO:0006053; cell-viability assay, ECO:0005004; and computationally derived evidence, ECO:0007672. Each submission may be assigned as many terms as needed, depending on the complexity of the experiment being annotated. At present, 63 such terms have been used in Dashboard submissions. All recent submissions are annotated with ECO codes, and earlier submissions have been retroactively annotated. ECO terms can be searched directly in the main search box, either by name or by code, and result pages for each term can be referenced with stable Dashboard URLs.
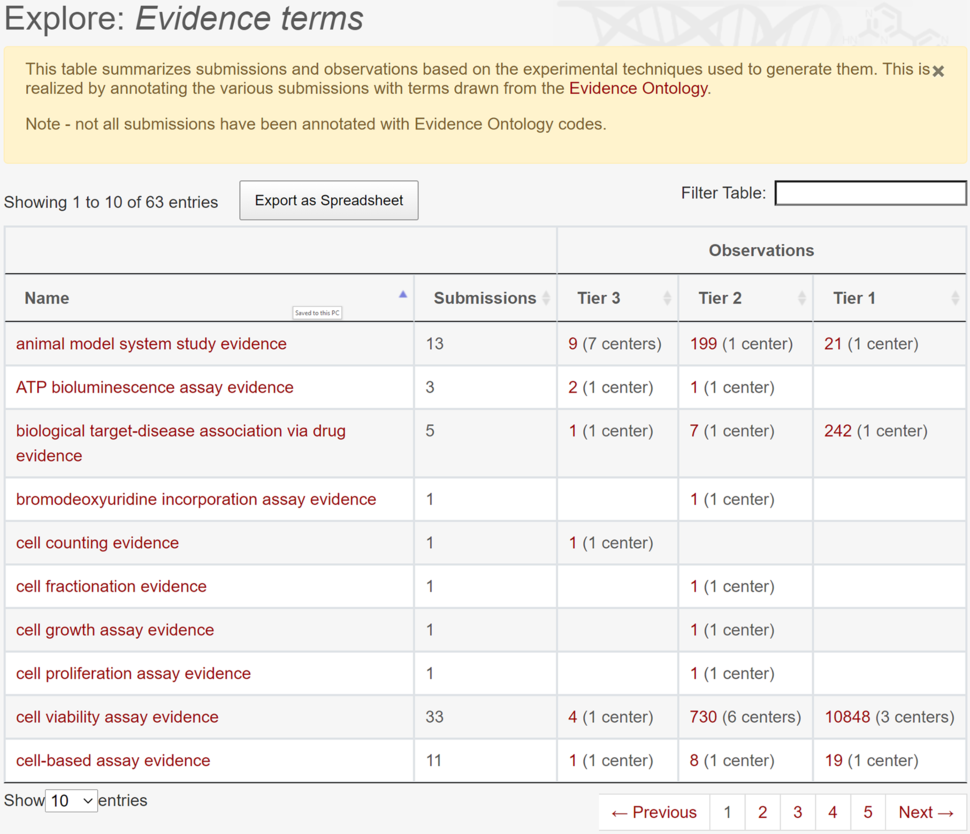
Figure 3. Summary of evidence terms, including counts of submissions by Tier linking to relevant observations.
Technical Improvements
In addition to the new features, we made major improvements to the existing Dashboard ‘search’ function for faster searching and browsing. Searches involving multiple words were improved to list the most relevant results first and to identify observations matching all the words in a query. These improvements make ‘search’ a powerful tool for quickly finding results involving multiple terms, for example involving both a particular compound and a particular gene. With ongoing code updates, the Dashboard is also kept in-line with the latest web-security standards. Currently (early 2021), a hierarchical search capability is being implemented. To do this, diseases and ECO terms will be represented as hierarchical ontologies, and this new function will allow the Dashboard to return more specific terms (children) of the matched term. The Dashboard has also been improved to use stable URLs for all results, so that the results can be shared, saved, or referenced.
Links to External Resources
The Dashboard content has been enriched through additional external links to authoritative information sources for subjects, such as compounds and cell lines. To simplify enabling and extending this improvement, a new framework to manage such links in the Dashboard was developed. Among the new resources supported in this fashion are DepMap (Cancer Dependency Map, for compounds), Cellosaurus (cell lines), and MalaCards (human diseases).
The Dashboard features a “Gene Cart”, which allows query of several gene and protein interaction databases and provides a graphical view of the result. Two new external resources have been recently added to support Gene Cart function – “EnrichR” for gene-set-enrichment analysis and “STRING” for protein-protein interactions networks. Users can now send a custom list of genes to either of these web applications for analysis and visualization of results.
A Dashboard RESTful API was also implemented to allow external applications to directly query and receive results from the Dashboard for their own purposes. We envision that the API can serve as a substrate for external app developers to use Dashboard data in their own applications, and (in principle), the Dashboard can serve as a conduit directing users to these apps. Presently, demonstration apps that leverage work done toward the NCATS Biomedical Data Translator are being developed.
Subject Data Improvements
As with all Dashboard subjects, each gene has its own subject page, which provides information and external links to other resources, as well as a list of observations in which the gene appears. Subject pages have been recently augmented with additional synonyms from NCBI, enhancing the ability to find genes via old or alternate names. The ability to support submissions from multiple Centers, or from institutions external to the CTD2 Network, has also been added.
Summary and Outlook
Our recent updates to the CTD2 Dashboard aim to make it more useful and accessible to end users. The presentation of the landing page is more concise, current and past submissions are annotated with structured evidence terms, and an expressive summary of Dashboard content has been added. Substantial technical improvements have been made to the ‘search’ function, and new links out to several external resources have been added. As a “living document”, the CTD2 Dashboard continues to grow in submission content over time, so users can gain new insights from the Network by performing even the same searches over time. For members of the CTD2 Network, the evolving Dashboard project represents not only the collective insights of the Network, but an increasingly rich opportunity to present experimental and computational evidence in a cross-linked, multimedia format.
Reference
- Aksoy BA, Dancík V, Smith K, et al. CTD2 Dashboard: a searchable web interface to connect validated results from the Cancer Target Discovery and Development Network. Database (Oxford). 2017 Jan 1;2017:bax054. PMID: 29220450