Are All RAS Proteins Created Equal in Cancer?
, by Channing Der

The three human RAS genes encode four highly related RAS proteins (82-90% sequence identity), with alternative gene splicing accounting for the expression of the highly related K-RAS4A and K-RAS4B proteins (90% identity). There is an emerging perception that the roles and functions of specific RAS proteins in cancer are distinct and, consequently, distinct anti-RAS strategies will be needed for effective inhibition of each RAS protein. Here we review the mutational frequency of the three RAS genes in human cancers and their ability to induce cancer in specific tissues.
Of the three mammalian RAS genes, only HRAS and KRAS were identified originally as the cellular counterparts of the viral oncogenes of acute transforming Harvey and Kirsten sarcoma retroviruses (Cox and Der, 2010). NRAS joined the family only after its detection in an NIH 3T3 focus formation assay to detect activated oncogenes in genomic DNA isolated from a human neuroblastoma cell line. Historically, despite the more prevalent mutation frequencies of KRAS and NRAS in human cancers, HRAS has been the most intensively studied. This focus was due in part to the greater availability of reagents to study HRAS and to the assumption that the functions of all four RAS proteins were largely equivalent. Thus, much of our understanding of RAS protein structure, biochemistry, and biology comes from the study of HRAS. Only with the unexpected and disappointing discovery that KRAS4B and NRAS escaped the action of farnesyltransferase inhibitors by undergoing alternate prenylation did attention begin to shift to KRAS, and, in particular, the KRAS 4B isoform. Interestingly, it is the still largely ignored KRAS4A isoform that is encoded by the original Kirsten murine sarcoma virus.
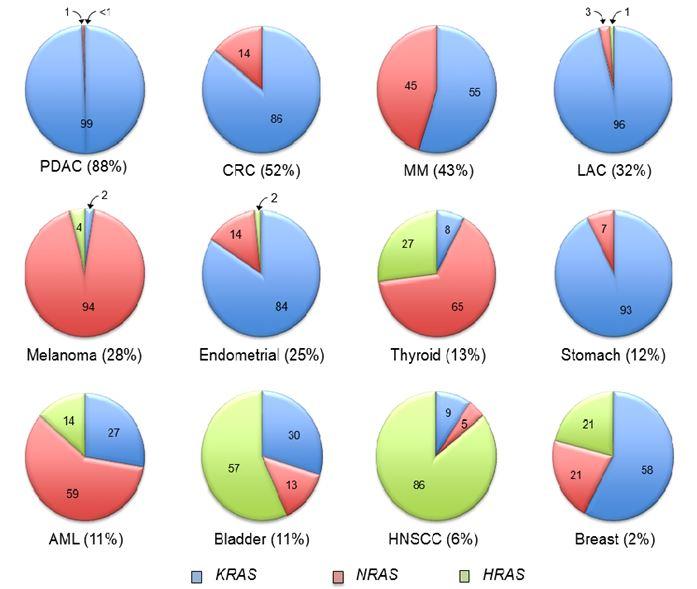
The frequency of mutation of each RAS gene varies widely in different cancer types. In pancreatic ductal adenocarcinoma (PDAC) there is a near 100% frequency of KRAS mutations (Figure 1.) This contrasts with cutaneous melanoma or acute myelogenous leukemia (AML), where NRAS comprises 94% and 59%, respectively, of RAS mutations in these cancers. Conversely, mutations of KRAS and NRAS are seen at near equivalent frequencies in multiple myeloma (MM). Although rare overall (1-3% of all human cancers), HRAS mutations are predominant in bladder urothelial (57%) and head and neck squamous cell (HNSCC; 86%) carcinomas.
Why the frequency of RAS gene mutations varies widely in cancers that arise from different tissues remains largely unresolved. One logical assumption is that a specific RAS isoform is favored simply by level of expression. However, the preferential mutation of KRAS versus NRAS in colorectal carcinoma (CRC) cannot be explained simply on this basis. NRAS (Haigis et al., 2008) and HRAS (Schuhmacher et al., 2008) are both expressed in mouse colonic cells, yet KRAS mutations are six times more common than NRAS, and HRAS mutations are not found in CRC.
Another possible basis for these variations is that the different RAS genes exhibit different potencies in driving cancers from different tissues. This possibility is supported by genetically engineered mouse model analyses in which mutant KRAS G12D but not NRAS G12D caused colon cancer progression in adenomatous polyposis coli (APC)-deficient colonic epithelial cells (Haigis et al., 2008). Interestingly, although colon and rectal cancers are generally described as a single cancer type, a recent study found that NRAS mutations were associated with rectal versus colon cancer (12.5% versus 0.6%, respectively) (Russo et al., 2014), supporting distinct roles for RAS isoforms in driving cancer from different tissues.
Another possibility is that the carcinogenic assault and efficiency of DNA repair that each tissue faces will favor the mutational activation of a specific RAS gene. This possibility was tested in several mouse models of carcinogen-induced RAS gene mutation and cancer induction. One study used the widely utilized two-stage skin carcinogenesis model (7,12-dimethyl-benz anthracene; DMBA)/ phorbol ester 12-O-tetradecanoylphorbol-13 acetate; TPA). The DMBA/TPA carcinogenesis regimen results in HRAS Q61L mutation and formation of skin papillomas. In squamous cell carcinomas, HRAS is the predominant isoform mutated (8%), followed by KRAS (3%) and NRAS (2%) (Catalogue of Somatic Mutations In Cancer [COSMIC] database). When applied to HRAS-null mice, KRAS mutation (G12, G13 or Q61) and skin papilloma formation occurred, albeit at a sixfold lower frequency (Ise et al., 2000). This result suggested that sensitivity to DNA mutagenesis, rather than a requirement for activation of a specific RAS protein, is a basis for RAS isoform preference in cancer induction from a particular tissue.
Another study addressed this question by using a urethane carcinogenesis model in which treatment of mice with this carcinogen causes KRAS mutation and lung tumor formation. KRAS mutation represents 96% of RAS mutations in human lung adenocarcinoma (LAC) (Figure 1.) When applied to a mouse with the HRAS coding sequence under control of the KRAS allele (i.e., HRAS replaced KRAS in the KRAS genomic locus), HRAS mutation-driven lung tumors occurred, and at a higher frequency than seen with wild-type mice (To et al., 2008). These results suggest that KRAS regulatory elements, rather than the encoded protein, was a basis for the preference of KRAS mutation in lung tumor formation.
Although NRAS is the predominant RAS mutation (94%) found in human cutaneous melanoma (Chin et. al., 1997), melanocyte-specific expression of activated HRAS G12V and KRAS G12D can drive melanoma formation in mice (Table 1).
More recently, a provocative finding by Counter and colleagues was the predominance of rare codons in the KRAS gene relative to HRAS, resulting in reduced translation and expression of KRAS protein (Lampson et al., 2013). When the KRAS gene was codon optimized, this enhanced both KRAS protein expression and transforming activity when tested in various cell lines. These results prompted the hypothesis that, since mutant RAS causes senescence in normal cells, KRAS is preferentially mutated in cancer because its mutational activation is better tolerated in preneoplastic tissue. However, this cannot explain why NRAS or HRAS is preferentially mutated in other cancer types (Figure 1.) Furthermore, the suggestion that activated HRAS protein causes a greater degree of senescence in normal tissue is at odds with the existence of germline HRAS G12S/A mutations in Costello syndrome individuals (Rauen, 2013). Additionally, mice with a germline HRAS G12V mutation were born at the expected Mendelian ratio, were fertile, and survived at rates comparable to wild-type mice (Schuhmacher et al., 2008).
In summary, why a specific RAS isoform is preferentially mutated in specific cancers remains to be understood. While experimental and correlative studies argue for different reasons, perhaps there is some truth to all these causes, and, additionally, more causes that remain to be discovered. Whether this will translate to the need for RAS isoform-selective therapies will also be an issue that will not be answered until effective anti-RAS therapies are finally developed.
| Samples | Altera- tions |
KRAS | Altera- tions |
NRAS | Altera- tions |
HRAS | All RAS | Study; Refs |
|---|---|---|---|---|---|---|---|---|
| 114 | 114 | 100.0 | 0 | 0.0 | 0 | 0.0 | 100.0 | JHU1 |
| 252 | 213 | 84.5 | 1 | .04 | 1 | 0.4 | 85.3 | ICGC (AU)2 |
| 85 | 65 | 76.5 | 1 | 1.2 | 0 | 0.0 | 77.6 | ICGC (CA)2 |
| 3 | 3 | 100.0 | 0 | 0.0 | 0 | 0.0 | 100.0 | Tgen3 |
| 454 | 395 | 87.0 | 2 | 0.4 | 1 | 0.2 | 87.7 | Total |
| Samples | Altera- tions |
KRAS | Altera- tions |
NRAS | Altera- tions |
HRAS | All RAS | Study; Refs |
|---|---|---|---|---|---|---|---|---|
| 11 | 6 | 54.5 | 0 | 0.0 | 0 | 0.0 | 54.5 | JHU4 |
| 11 | 5 | 45.5 | 2 | 18.2 | 0 | 0.0 | 63.6 | Broad5 |
| 72 | 37 | 51.4 | 2 | 2.8 | 0 | 0.0 | 54.2 | Genentech6 |
| 224 | 94 | 42.0 | 20 | 8.9 | 0 | 0.0 | 48.7 | TCGA7 |
| 318 | 142 | 44.7 | 24 | 7.5 | 0 | 0.0 | 52.2 | Total |
| Samples | Altera- tions |
KRAS | Altera- tions |
NRAS | Altera- tions |
HRAS | All RAS | Study; Refs |
|---|---|---|---|---|---|---|---|---|
| 67 | 17 | 25.4 | 17 | 25.4 | 0 | 0.0 | 50.7 | CGP8 |
| 205 | 45 | 22.0 | 37 | 18.0 | 0 | 0.0 | 39.0 | Broad9 |
| 272 | 62 | 22.8 | 54 | 19.9 | 0 | 0.0 | 42.6 | Total |
| Samples | Altera- tions |
KRAS | Altera- tions |
NRAS | Altera- tions |
HRAS | All RAS | Study; Refs |
|---|---|---|---|---|---|---|---|---|
| 57 | 13 | 22.8 | 1 | 1.8 | 0 | 0.0 | 24.6 | Genentech10 |
| 163 | 60 | 36.8 | 3 | 1.8 | 0 | 0.0 | 38.7 | TSP11 |
| 230 | 75 | 32.6 | 1 | 0.4 | 1 | 0.4 | 33.5 | TCGAin revision |
| 183 | 49 | 26.8 | 1 | 0.5 | 1 | 0.5 | 27.9 | Broad12 |
| 637 | 197 | 30.9 | 6 | 0.9 | 2 | 0.3 | 32.2 | Total |
| Samples | Altera- tions |
KRAS | Altera- tions |
NRAS | Altera- tions |
HRAS | All RAS | Study; Refs |
|---|---|---|---|---|---|---|---|---|
| 228 | 3 | 1.3 | 67 | 29.4 | 3 | 1.3 | 31.6 | TCGAprovisional |
| 121 | 0 | 0.0 | 31 | 25.6 | 1 | 0.8 | 26.4 | Broad13 |
| 91 | 0 | 0.0 | 19 | 20.9 | 1 | 1.1 | 22.0 | Yale14 |
| 440 | 3 | 0.7 | 117 | 26.6 | 5 | 1.1 | 28.4 | Total |
| Samples | Altera- tions |
KRAS | Altera- tions |
NRAS | Altera- tions |
HRAS | All RAS | Study; Refs |
|---|---|---|---|---|---|---|---|---|
| 248 | 53 | 21.4 | 9 | 3.6 | 1 | 0.4 | 24.6 | TCGA15 |
| Samples | Altera- tions |
KRAS | Altera- tions |
NRAS | Altera- tions |
HRAS | All RAS | Study; Refs |
|---|---|---|---|---|---|---|---|---|
| 401 | 4 | 1.0 | 34 | 8.5 | 14 | 3.5 | 13.0 | TCGAprovisional |
| Samples | Altera- tions |
KRAS | Altera- tions |
NRAS | Altera- tions |
HRAS | All RAS | Study; Refs |
|---|---|---|---|---|---|---|---|---|
| 220 | 25 | 11.4 | 2 | 0.9 | 0 | 0.0 | 12.3 | TCGAprovisional |
| Samples | Altera- tions |
KRAS | Altera- tions |
NRAS | Altera- tions |
HRAS | All RAS | Study; Refs |
|---|---|---|---|---|---|---|---|---|
| 200 | 8 | 4.0 | 15 | 7.5 | 0 | 0.0 | 11.5 | TCGA16 |
| 55 | 0 | 0.0 | 2 | 3.6 | 4 | 7.3 | 10.9 | ICGC (KR) |
| 255 | 8 | 3.1 | 17 | 6.7 | 4 | 1.6 | 11.4 | Total |
| Samples | Altera- tions |
KRAS | Altera- tions |
NRAS | Altera- tions |
HRAS | All RAS | Study; Refs |
|---|---|---|---|---|---|---|---|---|
| 99 | 7 | 7.1 | 2 | 2.0 | 15 | 15.2 | 24.2 | BGI17 |
| 130 | 0 | 0.0 | 2 | 1.5 | 6 | 4.6 | 6.2 | TCGA18 |
| 97 | 4 | 4.1 | 0 | 0.0 | 0 | 0.0 | 4.1 | MSKCC19 |
| 28 | 0 | 0.0 | 1 | 3.6 | 0 | 0.0 | 3.6 | TCGAprovisional |
| 354 | 11 | 3.1 | 5 | 1.4 | 21 | 5.9 | 10.5 | Total |
Data were also compiled from http://www.cbioportal.org/public-portal/.
Table References
- Jones, S. et al. (2008). Core signaling pathways in human pancreatic cancers revealed by global genomic analyses. Science 321, 1801-1806.
- Biankin, A. V. et al. (2012). Pancreatic cancer genomes reveal aberrations in axon guidance pathway genes. Nature 491, 399-405.
- Liang, W. S. et al. (2012). Genome-wide characterization of pancreatic adenocarcinoma patients using next generation sequencing. PLoS One 7, e43192.
- Wood, L. D. et al. (2007). The genomic landscapes of human breast and colorectal cancers. Science 318, 1108-1113.
- Bass, A. J. et al. (2011). Genomic sequencing of colorectal adenocarcinomas identifies a recurrent VTI1A-TCF7L2 fusion. Nat Genet 43, 964-968.
- Seshagiri, S. et al. (2012). Recurrent R-spondin fusions in colon cancer. Nature 488, 660-664.
- The Cancer Genome Atlas Network (2012). Comprehensive molecular characterization of human colon and rectal cancer. Nature 487, 330-337.
- Bolli, N. et al. (2014). Heterogeneity of genomic evolution and mutational profiles in multiple myeloma. Nat Comm 5, 2997, doi:10.1038.
- Lohr, J. G. et al. (2014). Widespread genetic heterogeneity in multiple myeloma: implications for targeted therapy. Cancer Cell 25, 91-101.
- Kan, Z. et al. (2010). Diverse somatic mutation patterns and pathway alterations in human cancers. Nature 466, 869-873.
- Ding, L. et al. (2008). Somatic mutations affect key pathways in lung adenocarcinoma. Nature 455, 1069-1075.
- Imielinski, M. et al. (2012). Mapping the hallmarks of lung adenocarcinoma with massively parallel sequencing. Cell 150, 1107-1120.
- Hodis, E. et al. (2012). A landscape of driver mutations in melanoma. Cell 150, 251-263, doi:10.1016/j.cell.2012.06.024.
- Krauthammer, M. et al. (2012). Exome sequencing identifies recurrent somatic RAC1 mutations in melanoma. Nat Genet 44, 1006-1014, doi:10.1038/ng.2359.
- Kandoth, C. et al. (2013). Integrated genomic characterization of endometrial carcinoma. Nature 497, 67-73.
- The Cancer Genome Atlas Research Network (2013). Genomic and epigenomic landscapes of adult de novo acute myeloid leukemia. New Engl J Med 368, 2059-2074.
- Guo, G. et al. (2013). Whole-genome and whole-exome sequencing of bladder cancer identifies frequent alterations in genes involved in sister chromatid cohesion and segregation. Nat Genet 45, 1459-1463.
- The Cancer Genome Atlas Research Network (2014). Comprehensive molecular characterization of urothelial bladder carcinoma. Nature 507, 315-22.
- Iyer, G. et al. (2013). Prevalence and co-occurrence of actionable genomic alterations in high-grade bladder cancer. J Clin Oncol 31, 3133-3140.
References
- Chin, L., Pomerantz, J., Polsky, D., Jacobson, M., Cohen, C., Cordon-Cardo C., Horner J.W. 2nd and DePinho R.A. (1997). Cooperative effects of INK4a and RAS in melanoma susceptibility in vivo. Genes Dev. 11, 2822-2834.
- Cox, A.D., and Der, C.J. (2010). RAS history: The saga continues. Small GTPases 1, 2-27.
- Haigis, K.M., Kendall, K.R., Wang, Y., Cheung, A., Haigis, M.C., Glickman, J.N., Niwa-Kawakita, M., Sweet-Cordero, A., Sebolt-Leopold, J., Shannon, K.M., et al. (2008). Differential effects of oncogenic K-RAS and N-RAS on proliferation, differentiation and tumor progression in the colon. Nat Genet 40, 600-608.
- Ise, K., Nakamura, K., Nakao, K., Shimizu, S., Harada, H., Ichise, T., Miyoshi, J., Gondo, Y., Ishikawa, T., Aiba, A., and Katsuki, M. (2000). Targeted deletion of the H-RAS gene decreases tumor formation in mouse skin carcinogenesis. Oncogene 19, 2951-2956.
- Lampson, B.L., Pershing, N.L., Prinz, J.A., Lacsina, J.R., Marzluff, W.F., Nicchitta, C.V., MacAlpine, D.M., and Counter, C.M. (2013). Rare codons regulate KRAS oncogenesis. Curr Biol 23, 70-75.
- Liu, W., Monahan, K.B., Pfefferle, A.D., Shimamura, T., Sorrentino, J., Chan, K.T., Roadcap, D.W., Ollila, D.W., Thomas, N.E., Castrillon, D.H., Miller, C.R., Perou, C.M., Wong, K.K., Bear, J.E. and Sharpless, N.E. (2012). LKB1/STK11 inactivation leads to expansion of a prometastatic tumor subpopulation in melanoma. Cancer Cell 21, 751-764. Rauen, K.A. (2013). The RASopathies. Annu. Rev. Genomics Hum. Genet. 14, 355-369.
- Schuhmacher, A.J., Guerra, C., Sauzeau, V., Cañamero, M., Bustelo, X.R. and Barbacid M. (2008). A mouse model for Costello syndrome reveals an Ang II-mediated hypertensive condition. J. Clin. Invest. 118, 2169-179.
- To, M.D., Wong, C.E., Karnezis, A.N., Del Rosario, R., Di Lauro, R., and Balmain, A. (2008). KRAS regulatory elements and exon 4A determine mutation specificity in lung cancer. Nat Genet 40, 1240-1244.