Mutations in Human Cancers Through the Lens of KRAS
, by Bob Stephens and Jim Hartley
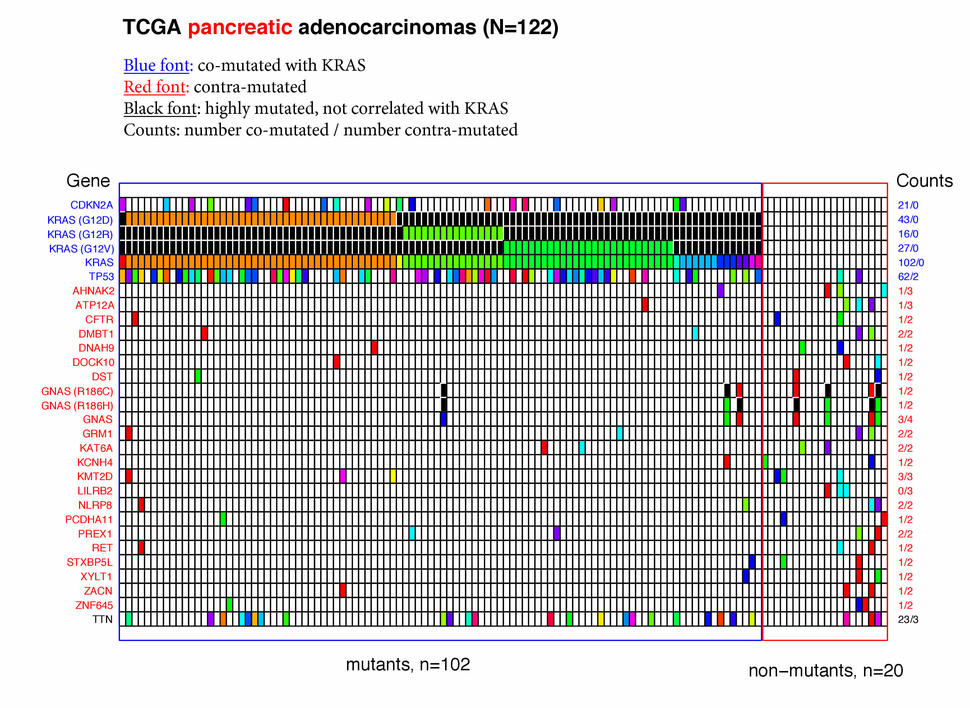
Figure 1. Common mutations in pancreatic adenocarcinomas.
The NIH Center for Cancer Genomics hosts a gateway to seven large data sets, including The Cancer Genome Atlas (TCGA), the Cancer Cell Line Encyclopedia, and the Exceptional Responders Initiative. Since RAS genes are frequent drivers of human cancers, there are significant subsets of these "Big Data" that are related to the status of RAS genes and pathways in tumors from cancer patients. We in the NCI RAS Initiative have begun to delve into these relationships to derive new clues about the biology of cancers containing mutant RAS genes.
It is known that some KRAS mutations are more common particular cancer types. For example, G12D mutations are common in pancreatic cancers, whereas G12C mutations are the most common in lung cancers (Stephen, et al., Cancer Cell 25, 272, 2014). Since mutations in the KRAS gene are thought to be early or initiating events in human cancers, we asked if different KRAS mutants might select for particular amino acid changes in other mutated genes ("co-mutated"). In the same samples we also screened for frequent specific amino acid changes in genes in the same samples when KRAS was not mutated ("contra-mutated"). Here we present the results of analyses of exome sequences of human lung, pancreas, colon, and rectal adenocarcinoma samples deposited in the TCGA. (Note that TCGA data treat colon and rectal cancers as separate diseases.) We found that common missense mutations in KRAS do not select for specific co-mutations in other genes.
Key to the figures
- Each column represents a single patient sample.
- Each row represents a single gene that passes the significance filters described in Methods.
- Colored rectangles represent genes that contained missense mutations in that patient sample.
- White rectangles represent genes that were wild-type in that patient sample.
- The color of each rectangle denotes the particular amino acid change in that gene. The colors are arbitrary, thus similar colors do not have any meaning. For example, in rectal adenocarcinomas the green rectangles in the BRAF row represent mutations of valine to glutamic acid (at position 600), while the green rectangles in the TP53 row represent a different starting and mutated amino acid.
- When a particular amino acid change in a gene was present often enough to pass a significance filter (for example BRAF V600E), it was given its own row. Black rectangles in such rows represent the other mutations of that gene.
- Gene names are alphabetical within each of three groups.
- Blue gene names represent genes that were at least four times more likely to be mutated when KRAS is mutated.
- Red gene names represent genes that were at least four times more likely to be mutated when KRAS is wild-type.
- Black gene names represent genes that were mutated in at least 20% of the patient samples but whose status does not correlate with KRAS mutation status.
- The "Counts" for each gene represent a) the number of times that gene was mutated in samples that contained mutant KRAS; and b) the number of times that gene was mutated in samples that contained wild-type KRAS.
- See Methods for more precise definitions.
Results
TCGA data were analyzed for genes that were co-mutated when KRAS genes were mutated or wild-type, and for genes that were highly mutated regardless of KRAS mutation status. Results for pancreatic, lung, colon, and rectal cancer are displayed as a grid of rectangles colored to represent specific amino acid changes in each tumor sample.
Pancreatic adenocarcinomas
- KRAS was mutated in 84% (102 of 122) of the pancreatic adenocarcinoma samples. The most common mutants were G12D, G12V, and G12R; together these accounted for 86 of the 102 KRAS mutants.
- Two well-known tumor suppressor genes, TP53 and CDKN2A (p16 / INK4A), were co-mutated with KRAS (i.e., they were much more likely to be mutant in samples where KRAS was also mutant), but interestingly CDKN2A was almost always (17/21) mutated when TP53 was also mutant. As expected for suppressor genes, there was a wide variety of amino acid changes in these genes, reflecting the many ways a suppressor can be inactivated.
- There was no common mutational signature for the twenty pancreatic cancer patient samples with wild-type KRAS genes. Notably, mutations in TP53 and CDKN2A were rare in these samples.
- One gene, TTN, was mutated in 21% of the samples but these mutations were not correlated with the mutational status of KRAS. Since TTN is the largest gene in the genome (304 kb), this mutational frequency may be driven by the size of the gene rather than by any tumor-associated biology.
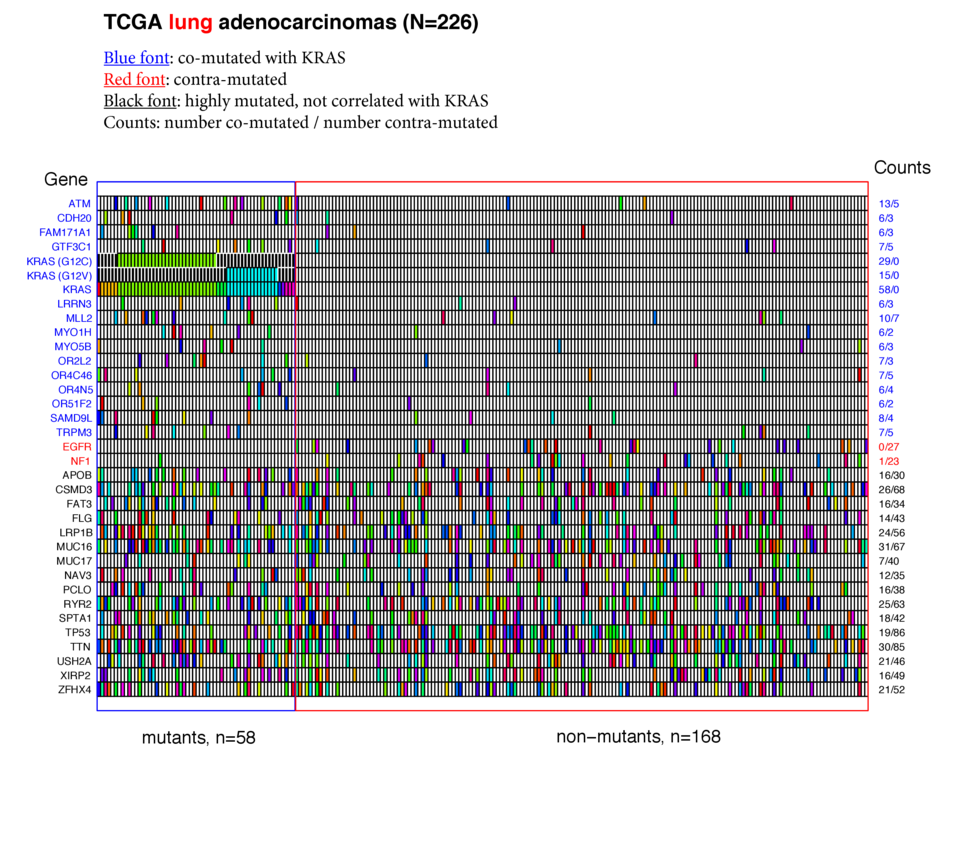
Figure 2. Common mutations in lung adenocarcinomas.
Lung adenocarcinomas
- KRAS was mutated in 26% (58 / 226) of the lung adenocarcinoma samples. Of these, G12C and G12V comprised the majority (44 / 58).
- In keeping with lung's potential exposure to high levels of environmental mutagens, 14 genes were co-mutated (at minimum levels) with mutant KRAS, and 16 genes were highly mutated without any correlation with KRAS status. In this latter class TTN (51%) and TP53 (46%) were the most frequently mutated.
- Notably, missense mutations in the EGFR (0 / 27) and NF1 (1 / 23) were almost completely absent from patient tumors that expressed mutant KRAS genes. Recent evidence suggests that mutations and EGFR and KRAS may be mutually exclusive not because of redundant phenotypes, but because they are synthetically lethal (Unni, et al., eLife 2015;10.7554/eLife.06907).
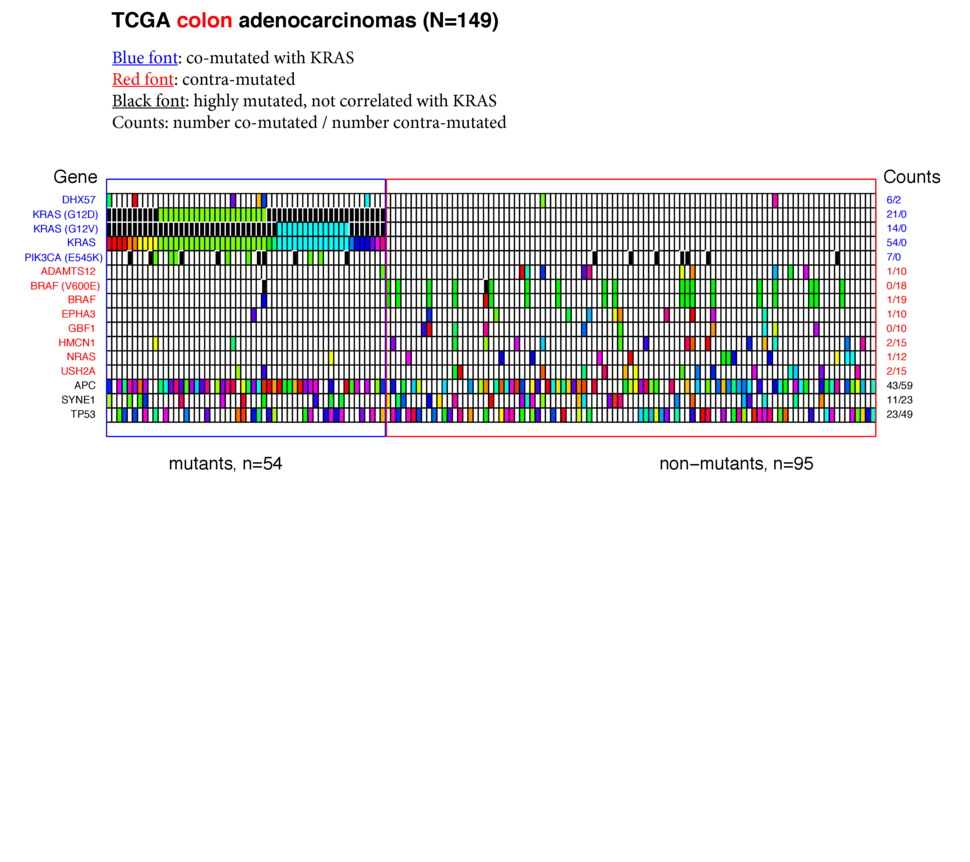
Figure 3. Common mutations in colon adenocarcinomas.
Colon adenocarcinomas
- KRAS was mutated in more than one third (54 / 149) colon adenocarcinomas. G12D and G12V mutants comprised more than half the KRAS mutants.
- The E545K mutant of PIK3CA passed the test for co-mutation with KRAS, even though the PIK3CA gene as a whole did not (the E545K mutation was only found in mutant KRAS tumors, whereas the other PIK3CA mutants were spread between KRAS mutant and KRAS wild-type tumors).
- Six genes, including BRAF (specifically the V600E mutant) and NRAS were substantially mutated when KRAS was wild-type.
- APC and TP53 were mutant in 68% and 48% of the colon samples respectively and not correlated with KRAS status.
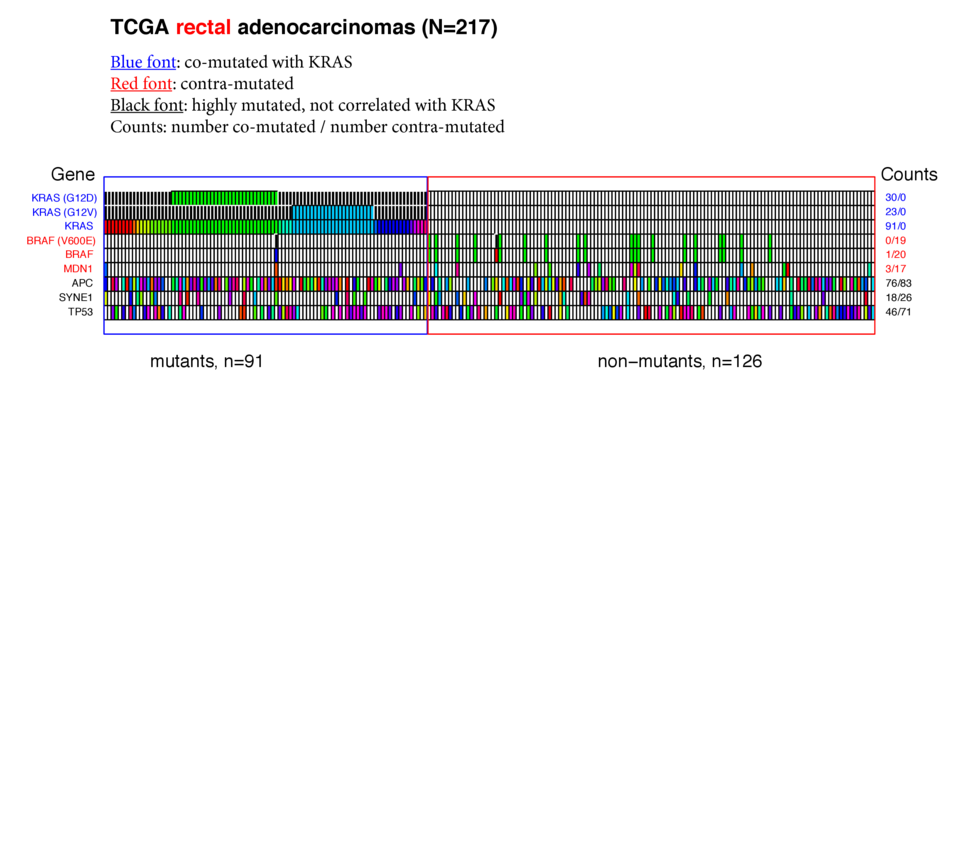
Figure 4. Common mutations in rectal adenocarcinomas.
Rectal adenocarcinomas
- In 217 rectal adenocarcinomas KRAS was mutant 91 times (42%). Similarly to the colon samples, G12D and G12V mutants predominated.
- Again similarly to the colon samples, BRAF V600E was strikingly contra-mutated with mutant KRAS (19 times in 126 samples with wt KRAS, zero in 91 samples with mutant KRAS).
- APC was mutant in almost three-quarters of the rectal samples, while TP53 was mutated in 55%.
For the four KRAS mutants, G12D, V, C, and R, that predominated in these human tumor samples, the algorithm described here detected no specific co-mutated amino acids in any other gene. We conclude that for this level of analysis on this data set it appears that there are many paths to cancer phenotypes after KRAS becomes mutated. It also seems likely that individual sample diversity is high enough to preclude deriving subtle differences given the numbers of samples harboring each mutant KRAS allele.
Discussion
Evidence is accumulating that different oncogenic mutants of KRAS have different biologies. These variations have been described in vitro (Hunter, et al., Mol Cancer Res. 2015 Jun 2. pii: molcanres.0203.2015), in vivo (Westcott, et al., Nature 517, 489, 2015), and in human patients (Ihle, et al., J Natl Cancer Inst 104, 228, 2012). With the availability of abundant sequence data from hundreds of human cancers, we hypothesized that the different behaviors of mutant KRAS proteins might select for specific co-mutations in other genes during progression from early KRAS mutations to full-blown cancer. While we found interesting patterns of co- and contra-mutation, we did not find evidence supporting our main hypothesis in colon, rectal, pancreatic, and lung cancer sequences collected by The Cancer Genome Atlas. However, it is still possible that these allele-specific differences could be manifested in other data platforms captured within TCGA such as methylation, expression, copy number variations and miRNA expression alterations.
We hope that you can suggest other interpretations of our data, or other RAS-centric ways of interrogating the big data sources as they become accessible.
Methods
Data were downloaded from the Broad GDAC site and formatted so they could be analyzed using Sequence Query Language (SQL). Note that all TCGA samples for each tumor type were included in our analyses. We wrote an R script that does the following:
Test 1: Some of the TCGA samples contain surprisingly high numbers (thousands) of mutated genes. We reasoned that most of the mutations in such samples were likely to be passengers, rather than drivers of cancer phenotypes. Therefore the mean number of mutant genes in samples from each tumor type was determined, and samples with numbers of mutant genes greater than two standard deviations above the mean were excluded from further tests.
Test 2: Highly mutated genes (in >15% of the samples but <85% of the samples) from the input RAS pathway gene list in tumor samples were candidates for use as index genes. Here we chose KRAS as the index gene for co-mutation analysis. In this iteration, the script selected only missense mutations in exons.
Test 3: The entire TCGA gene list was queried and co-mutated or contra-mutated genes were found by requiring candidate genes to pass two tests. Test 3a: Genes must be mutated in at least 10% of the samples where either KRAS is mutant (such as ATM and TP53 in lung adenocarcinoma), or where KRAS is wild-type (such as EGFR and TP53 in lung adenocarcinoma). Test 3b: Call genes co-mutated with KRAS when they are mutant more than 4 times as often (by frequency) when KRAS is mutant [(fGENEmut:KRASmut) / (fGENEmut:KRASwt) >4]. Call genes contra-mutated with KRAS when they are mutant 4 times as often when KRAS is wild-type [(fGENEmut:KRASmut) / (fGENEmut:KRASwt) <0.25]. Using these criteria, ATM is co-mutated with KRAS in the TCGA lung adenocarcinomas, and EGFR mutations are contra-mutated with KRAS in lung adenocarcinomas.
Test 4: Genes that were highly mutated (>20%) regardless of index gene (here, KRAS) status were also found. For example, TP53 is mutated in 74 of 154 (48%) colon cancers, but not biased toward either co-mutation with KRAS (42%) or contra-mutation with mutant KRAS genes (52%).
Test 5: Single missense mutations that satisfy either Test 3 or Test 4 are displayed in separate rows. The G12V mutation of KRAS in lung adenocarcinoma is shown as a separate line because that particular amino acid change satisfies Test 3 (>10% of the samples with mutant KRAS contain the KRAS G12V mutation and this is >4x the number when KRAS is wild-type (0)). In colon adenocarcinoma samples not only is BRAF contra-mutated with mutant KRAS, so is the particular V600E mutation of BRAF. Interestingly, while the PIK3CA genes as a group in colon samples do not pass Test 3 or Test 4 (26/154 are mutant, thus not highly mutated (Test 4), and not > 4-fold enriched in samples that are mutant for KRAS (15/54 vs 7/95 = 3.78 fold), the specific E545K mutation passes Test 3 as co-mutated with KRAS (mutant 7/57 when KRAS is mutant, mutant 0/97 when KRAS is wild-type). We do not know if there is a biological basis for this observation.
Results from the above tests are plotted as a grid of rectangles, in which each rectangle represents one gene in one patient tumor sample. For example the TCGA lung adenocarcinomas comprise 228 samples, which are displayed as vertical columns, and the R script described above generated 34 mutated genes for these samples (co-mutated, contra-mutated, or highly mutated), which are shown as rows across the samples.
When a gene is mutated in a particular sample, that rectangle is colored for that particular missense mutation. For example, ten different missense mutants of KRAS were found in the TCGA colon cancer samples (N = 129). Of these, 21 times the 12th amino acid of KRAS, glycine, was changed to aspartic acid (G12D), 14 times the same glycine was changed to valine (G12V), and in 17 other samples KRAS was mutated at other positions or to different amino acids. White rectangles in the diagrams show that gene in that tumor sample was wild-type.
Black rectangles appear only in rows in which a specific amino acid change passed the above tests, and represent mutations in that gene other than the specified mutation. For example, in lung adenocarcinomas the G12C mutation of KRAS passed the above tests, and such samples appear as green rectangles in the KRASG12C row. Patient samples with other KRAS mutations, such as G12V, G13D, etc. are represented as black rectangles in that row.