The Mutational Spectra of Cancer Genes in TCGA Data
, by Bob Stephens
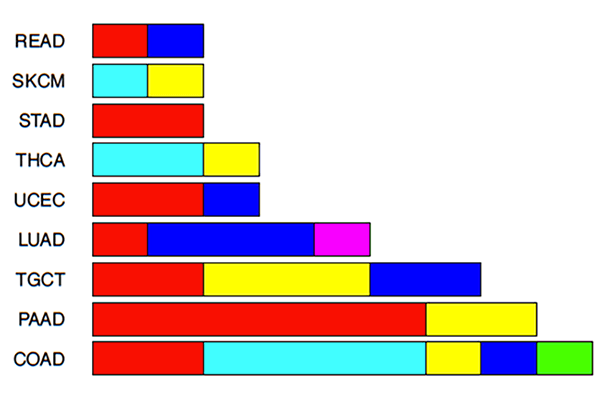
KRAS Q61 mutations found in different cancer types.
Cancer is at root a genetic disease, driven in almost all cases by mutations or rearrangements of otherwise normal genes. (The exceptions, such as cervical cancer, are caused by viruses.) The Cancer Genome Atlas (TCGA) is the largest and most comprehensive effort to date to characterize the genetic changes that drive or cooperate in human cancers. We in the NCI RAS Initiative use TCGA data to guide research priorities and understand how we might attack mutated RAS genes, which are major causes of human cancers. Here we present graphical representations of TCGA data on eight major cancer genes: BRAF, TP53, PIK3CA, PTEN, EGFR, and the three RAS genes themselves, KRAS, HRAS, and NRAS.
The TCGA has characterized over 10,000 samples of human tumors from over 30 tumor types, using technologies that have evolved rapidly since the program's start. The data we present here are derived from exome or whole genome sequencing, but extensive data have also been derived from RNAseq (for transcription and miRNAs) and methylation profiling (for epigenitic correlations). TCGA data have been foundational for hundreds of publications, and are likely to be valuable for many discoveries still to come.
For example, the data reveal that the proportions of different mutant RAS alleles vary among different tumor types. Thus KRAS G12C mutations are enriched in lung adenocarcinoma samples relative to pancreatic or colorectal tumor samples also mutated in KRAS. Similarly, the colorectal samples show an enrichment in G13 mutations and also A146 mutations. We now know these differences are at least partially the result of the different mutational environments represented in these different tissues. For example, cigarette smoking largely contributes to the G12C mutations in the lung, along with a specific EGFR mutation in that same tissue1. Many of these tumor type specificities have been described by Alexandrov, et al.2
On a more global scale, involvement of different RAS gene family members is observed in different cancers. For example, NRAS appears to be the dominant mutated RAS gene in both thyroid cancer and melanoma, while KRAS mutations are dominant in colorectal, lung, pancreas and uterine tumors. The NRAS mutant alleles are predominantly at the Q61 position while those in KRAS are predominantly at the G12 position.
Our goal here is to provide researchers with representations of the mutations found in RAS and other important cancer genes, and connect those data with the types of cancers in which they are found. "Is there a cancer in which the G13 position of KRAS is mutated more often than G12?" "In what cancers are KRAS Q61 mutations prevalent?" "What EGFR mutations are commonly found in glioblastoma?" The graphs we present here are sources of information about such questions.
TCGA Data Graphs
We tried to make the bar graphs for the mutations in the eight genes self-explanatory. Our analysis takes an input gene and retrieves all of the mutations recorded for that gene per sample for each tumor type within TCGA. For the purposes of this analysis, we included protein-changing mutations such as frame-shifts and non-synonymous substitutions. However, we excluded recorded mutations within introns and UTRs including those that impacted known splice sites within the gene. This was done for the purposes of simplifying the visualization and in no way diminishes the potential importance of these mutation classes. We included each tumor type if the gene of interest was mutated in 5 or more samples. Of the mutations retained after this filter step, mutations were counted both at the level of the specific allele, (e.g. KRAS G12V) and also at a position level (e.g. G12), permitting both allele-specific and position-specific enrichment to be assessed. Importantly, our counts reflect the aggregate of recorded mutations within a tumor type, and because some samples have more than one mutation the count reflects the number of patients with that mutation, but the sum across all counts does not reflect the number of patients affected overall. The plots are annotated with the total number of samples and the total number of mutations in an attempt to clarify this possible discrepancy.
KRAS Example Analyses
We illustrate our analyses by reference to the TCGA data for KRAS.
Specific Mutations for Each Tumor Type
The first pages of the analysis show plots of the specific mutations for each tumor type where more than 5 samples showed KRAS mutations. All the mutations in the TCGA database for that gene in that tumor are initially graphed, and if the number of mutations is >25, we remove the excess and plot the remainder ("Top 25").
An example of this can be seen on page 9 of the KRAS pdf. The G12D, G12V, and G13D mutations are the most common in colon adenocarcinoma.
Mutation Positions
Next, we move out a level and repeat the analysis but disregard the specific amino acid changes and graph only the positions of the mutations. In this way hot spots that correlate with biology are more obvious.
On page 23 of KRAS, the G12 position is almost the only mutation site found in pancreatic cancer.
Mutations Across all Cancer Types
After finishing with each tumor type, we analyze the mutations across all the cancer types. The analyses comprise:
- How many cancer types carry each specific mutation in the gene? On page 39 of KRAS, G12D mutations are found in 18 different kinds of cancer.
- What position in the gene is mutated in the various cancers? On page 41 of the KRAS analysis, the G12 position is found mutated in 24 different cancer types.
- How often does each specific mutation in the gene occur in all the cancers? On page 43, G12D, G12V, G12C, and G13D are the most common mutations across all cancers.
- What position in the gene is most often mutated in all the cancers? G12 mutations dominate the KRAS landscape, seen on page 45.
The Five Most Mutated Amino Acids in the Gene of Interest
- How often is the amino acid mutated in the different cancer types? Mutant G12 codons occur most frequently in lung, pancreatic, and colon (page 46), while mutant G13 codons are most commonly found in in colon, stomach, and rectum (page 49). Note that this only a measure of where that type of mutation is found most often, not that G13 mutations are ever more frequent than G12s. For example, even though the most frequent KRAS mutation in stomach adenocarcinoma is G13D (page 28), in the aggregate G12 mutations are ~50% more frequent than G13 mutations (page 29).
- What is the distribution of specific amino acid changes at that position in the various tumor types? On page 47, G12C is the most common mutant in lung, while G12D is the most common in pancreatic tumors.
- The proportional views of the data make it easier to judge when the numbers of tumors vary. For example, page 48 shows the same data as page 47, but proportional instead of absolute.
- Finally, two summary views of the positions of mutations in each gene across all cancers, organized by cancer type. G12 mutations comprise more than half the mutations in KRAS in almost all cancers (pages 61 and 62).