An official website of the United States government

DataViz + Cancer

Data are only as useful as the insights we can glean from them.

A number of events, supported by the Cancer Moonshot, explored the intersection of data visualization and cancer. These collaborative activities examined how recent advances in interactive media and data visualization can help solve challenges in cancer research.

Micro Labs

These inspiring conversations between thought leaders from the Cancer Moonshot and creative visualization experts were followed by cross-disciplinary collaborative discussions on the frontiers of cancer data visualization.

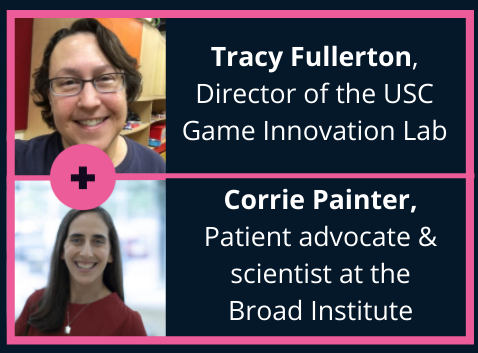
Micro Lab 1 (August 31, 2020): How can game design help patients, clinicians, and researchers understand cancer together?

Micro Lab 1 Recording

DataViz + Cancer Micro Lab 1 Speakers: Tracy Fullerton (Director of USC Game Innovation Lab) and Corrie Painter  (Patient advocate and research scientist at the Broad Institute)

Micro Lab 2 (September 1, 2020): How can VR and other UX approaches help us visualize cancer complexity?

Micro Lab 2 Recording

Speakers of DataViz + Cancer Micro Lab 2: Joe Gray (Director of OHSU Spatial Systems Biomedicine) and Sabrina Culyba (Independent designer of transformational games and XR experiences)

Micro Lab 3 (September 2, 2020): How can advanced data visualizations help us address challenges in cancer research?

Micro Lab 3 Recording

Speakers of DataViz + Cancer Micro Lab 3: Nils Gehlenborg (Harvard professor integrating visual and computational approaches) and Kunle Odunsi (Physician scientist and co-leader of Roswell Park Cancer Center’s Tumor Immunology and Immunotherapy Program)

Micro Lab 4 (September 4, 2020): How can interactive media help us implement smarter cancer prevention and control strategies?

Micro Lab 4 Recording

Speakers of DataViz + Cancer Micro Lab 4: Lindsay Grace (Knight Chair of interactive media at the University of Miami School of Communication) and Karen Emmons (National Academy member and Director of Harvard’s Community Engagement Program)

Micro Lab 5 (September 9, 2020): How can UX and data sharing help improve care for patients with cancer?

Micro Lab 5 Recording

DataViz + Cancer Micro Lab 5 Speakers: Jeremy Kriegel (User Experience Director at Audible, Inc. bringing interaction design to open source platforms) and rystal Mackall Physician scientist leading Stanford University’s internationally-recognized translational immuno-oncology research program)

Micro Lab 6 (October 3, 2022): How can interactive media and game design help advance brain cancer research?

Micro Lab 6 Recording

DataViz + Cancer Micro Lab 6 Speakers: Benjamin Stokes (Civic media scholar, neighborhood game designer, director of The Playful City Lab, and chief advisor of interactive media for the Peabody Awards) and Eric Holland (Physician-Scientist at the Fred Hutch Cancer Center; develops multidisciplinary approaches to address the mechanisms of brain tumors and new approaches to their treatment).

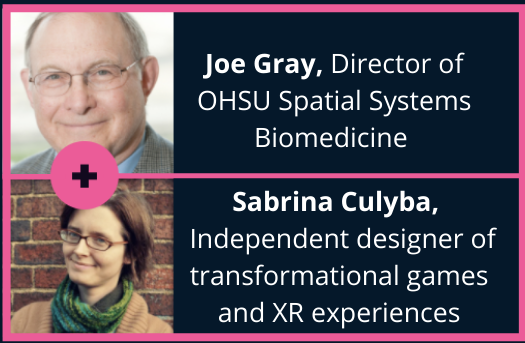
Micro Lab 7 (November 3, 2022): How can data visualization, AI, and VR help address challenges in mapping cell biology?

Micro Lab 7 Recording

DataViz + Cancer Micro Lab 7 Speakers: Emma Lundberg (Associate Professor of bioengineering and pathology at Stanford, focused on spatial proteomics, cell biology, and game-based large scale data analysis) and eMalick Njie (Founder of NeuroStorm Studios, translating neuroscience into real world applications and immersive experiences)

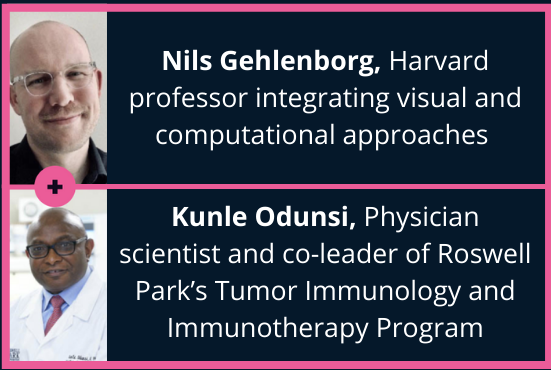
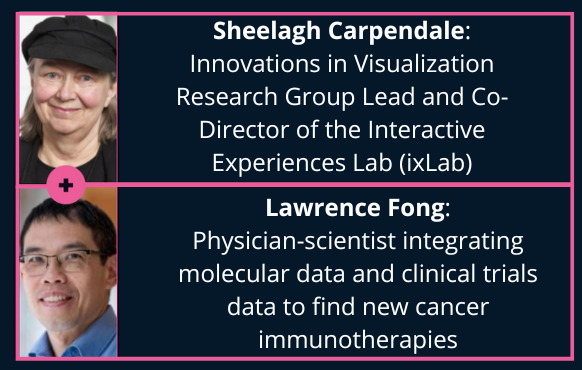
Micro Lab 8 (December 1, 2022): How can data visualization and interactive media advance immuno-oncology?

Micro Lab 8 Recording

MicroLab 8; Sheelagh Carpendale, PhD, Innovations in Visualization Research Group Lead and co-director of the Interactive Experiences Lab (ixLab); Lawrence Fong, MD Physician-scientist integrating molecular data and clinical trials data to find new cancer immunotherapies

Joint Event

On November 17, 2022, there was a convergence event for the Cancer Moonshot Seminar Series, NCI Emerging Technologies Seminar Series, and DataViz + Cancer. During the seminar, Dr. Zenep Gumus, Ph.D. (Icahn School of Medicine at Mt. Sinai) shared the development of user-friendly tools to enable data visualization for cancer research. 

How to Visually Explore Cancer-Omics Datasets?

Expo

This 2-day interactive symposium on Sept. 24-25, 2020 explored insights and facilitated networking between cancer researchers and data visualization experts. It included a virtual poster session of lightning talks and fostered collaborations for applying data visualization to cancer challenges.

Innovation Labs 

DataViz + Cancer Innovation Labs aimed to generate creative data visualization strategies for cancer research by bringing together interdisciplinary teams (involving game designers, data visualization experts, and cancer researchers) to generate novel ideas for visualizing and design to advance cancer research.

Designing a Better Patient Experience (August 2-6, 2021)

This Innovation Lab aimed to generate creative data visualization and design strategies to address challenges patients have across the spectrum of cancer care.

Teams at the Lab discussed new approaches to patient engagement based on data visualization, user experience, and game design to help patients better understand their health data, build trust with their medical team, and inform care decisions. Participants worked to develop innovative approaches to improve the cancer patient experience.
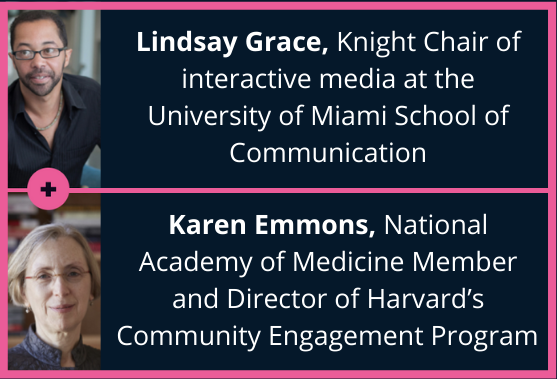
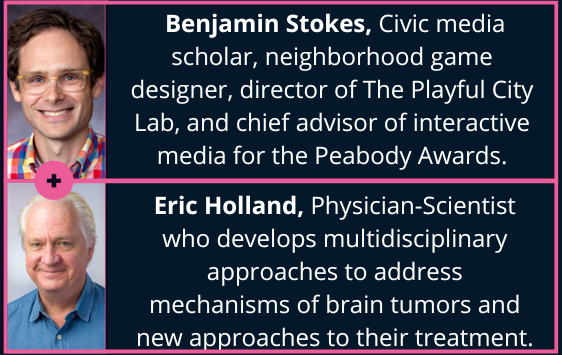
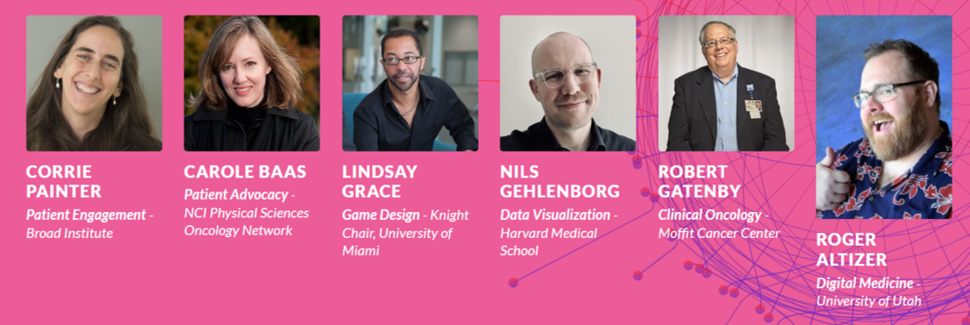
Mentor Panel:

Photos of the DataViz + Cancer Innovation Lab Mentor Panel: Corrie Painter (Patient Engagement, Broad Institute), Carole Baas (Patient Advocacy, NCI Physical Sciences - Oncology Network), Lindsey Grace (Game Design, Knight Chair, University of Miami), Nils Gehlenborg (Data Visualization, Harvard Medical School), Robert Gatenby (Clinical Oncology, Moffitt Cancer Center), & Roger Altizer ( Digital Medicine, University of Utah)

Visualizing Data in Context for Novel Insights (November 1 – 5, 2021)

This Innovation Lab promoted the development of novel methods for visualizing and interacting with cancer datasets.

Participants during the event addressed challenges of interacting with cancer data in an immersive way that allows for open exploration, manipulation, and discovery. They also discussed how data visualization and game design techniques from outside cancer research can help users interact with information in unique and useful ways. Teams worked to develop innovative approaches related to imaging and data visualization in the context of cancer research.
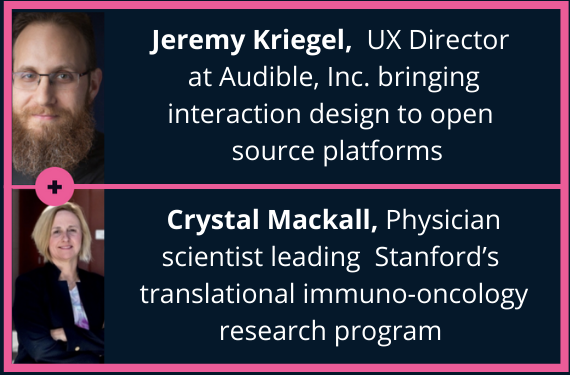
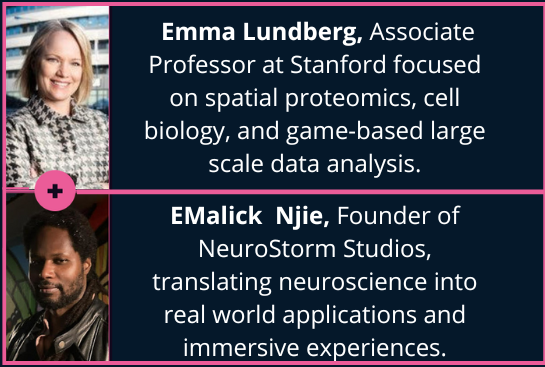
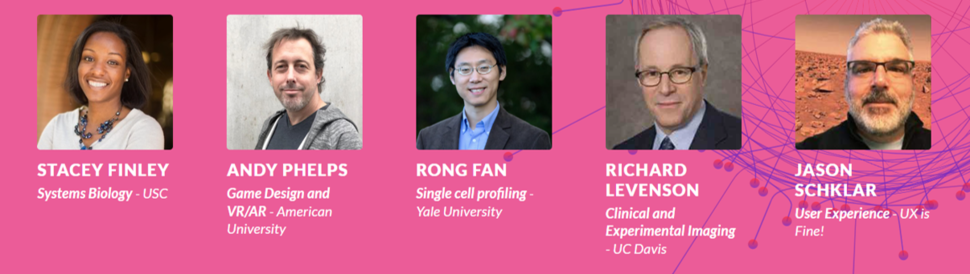
Mentor Panel:

Photos of the DataViz + Cancer Innovation Lab Mentor Panel: Stacey Finley (Systems Biology; USC),  Andy Phelps (Game Design and VR/AR, American University), Rong Fan (Single cell profiling, Yale University), Richard Levenson (Clinical and Experimental Imaging, UC Davis),  Jason Schklar (User Experience, UX is Fine!)

Social Media about DataViz + Cancer

Posts about these events can be found on social media using #DataViz4Cancer.

Contacts for DataViz + Cancer

For additional information about DataViz + Cancer events, please contact Dr. Dave Miller (david.miller3@nih.gov), Dr. Jennifer Couch (couchj@ctep.nci.nih.gov), or Dr. Tony Dickherber (anthony.dickherber@nih.gov).

  • Posted:

If you would like to reproduce some or all of this content, see Reuse of NCI Information for guidance about copyright and permissions. In the case of permitted digital reproduction, please credit the National Cancer Institute as the source and link to the original NCI product using the original product's title; e.g., “DataViz + Cancer was originally published by the National Cancer Institute.”

Email